Image Details
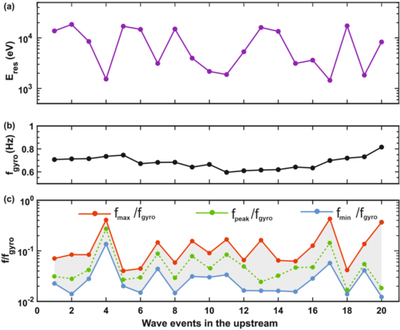
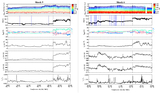
Caption: Figure 5.
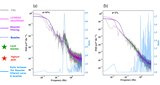
The plot illustrates the frequency ranges corresponding to wave activity at various upstream locations of shock 2. For any identified wave activity interval, the green dot indicates the frequency related to the PSD peak, while the blue and red dots mark the lower and upper frequencies encompassing the complete PSD-enhanced frequency range. All the frequencies are normalized with respect to the local gyrofrequency (fgyro) in the spacecraft frame, indicated in the middle middle. The top panel displays the corresponding particle energies capable of resonating with the waves at the frequencies of the PSD peaks.
Other Images in This Article

Copyright and Terms & Conditions
© 2025. The Author(s). Published by the American Astronomical Society.