Image Details
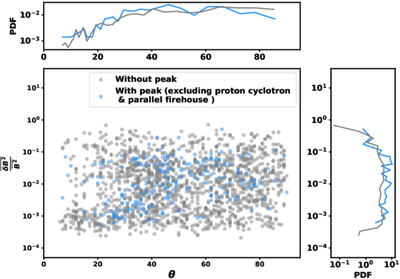
Caption: Figure 6.
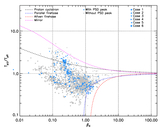
A scatterplot showing the mean square fluctuations (﹩\frac{\overline{\delta {B}^{2}}}{\bar{{B}^{2}}}﹩) associated with each 5 minute window for all the shocks. The values are plotted against the angle θ, representing the angle between the solar wind velocity and the mean magnetic field. Time windows corresponding to PSD peaks are marked with blue points, while time windows with no peaks are marked with gray points. PSD peaks associated with proton-cyclotron and parallel firehose instabilities are excluded. The right panel of the scatterplot, aligned vertically along the axis, shows the PDFs of the gray and blue points in the ﹩\frac{\overline{\delta {B}^{2}}}{\bar{{B}^{2}}}﹩ space, while the top panel displays the PDFs of the points in the θ space. Although the PDFs overlap, the KS test confirms that the gray and blue distributions are statistically distinct.
Other Images in This Article
Copyright and Terms & Conditions
© 2025. The Author(s). Published by the American Astronomical Society.