Image Details
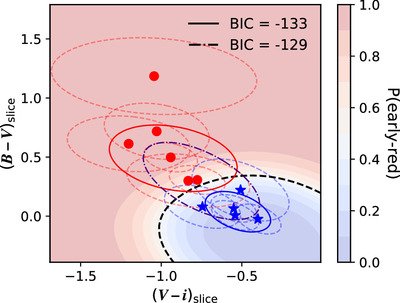
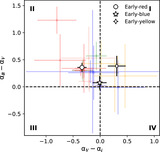
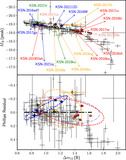
Caption: Figure 7.
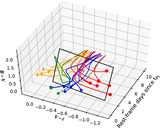
Intersections of the color curves of early-red (red filled circles) and early-blue (blue filled stars) events from Figure 5 with the oblique slice in the 3D space of B − V, V − i, and time defined by Equation (4) (black rectangle in Figure 5). The red/blue dashed covariance ellipses represent the 1σ uncertainties of their colors. The distributions of the colors of the early-red and early-blue events as two distinct populations (separated by Z-score ∼ 1.5) and that obtained for them as one population are compared using solid red/blue (for two populations) and dotted–dashed indigo (for one population) 1σ covariance ellipses, respectively. The color distributions and 1σ covariance ellipses are computed from best-fit hierarchical Gaussian class-conditional models (Appendix F) whose Bayesian information criteria (BICs) are shown in the legend. The black dashed curve is the decision boundary between the early-red and early-blue distributions, while the red/blue-shaded contour regions map the classification probability for early-red (= 1) vs. early-blue (= 0) as defined by the color bar.
Other Images in This Article
Show More
Copyright and Terms & Conditions
© 2025. The Author(s). Published by the American Astronomical Society.