Image Details
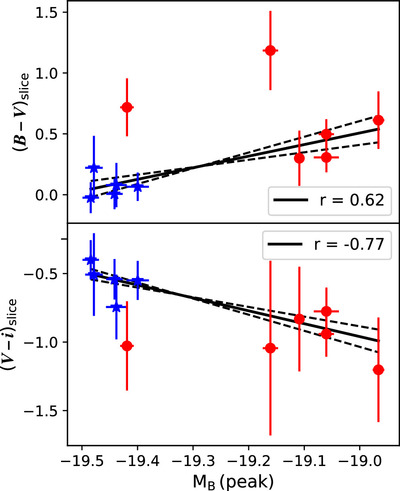
Caption: Figure 10.
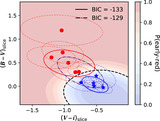
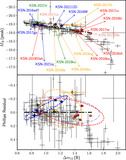
Intersection colors of early-red (red circles) and early-blue (blue stars) events with the oblique slice (Figure 7, black rectangle) that maximizes their separation, (B − V)slice (top) and (V − i)slice (bottom) from Table 6, compared to MB (peak) of the events. Black solid lines with dashed 1σ error regions are lines of best fit to the data with Pearson correlation coefficients (r) in the legend.
Other Images in This Article
Show More
Copyright and Terms & Conditions
© 2025. The Author(s). Published by the American Astronomical Society.
Copyright ©
2026 Astronomy Image Explorer. All Rights Reserved.