Image Details
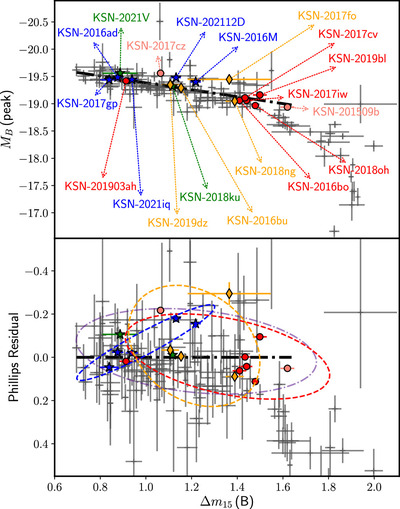
Caption: Figure 9.
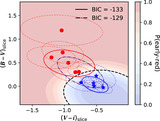
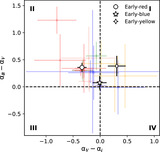
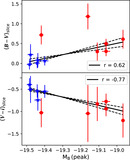
Top panel: Phillips diagram of MB (peak) and Δm15(B) of the KSP Type Ia SNe (colored symbols; same as Figure 5), as annotated with arrows, compared to the Phillips relation (black dashed line; J. L. Prieto et al. 2006) and a sample of other Type Ia SNe (gray crosses; C. R. Burns et al. 2018). Bottom panel: residuals of MB (peak) and Δm15(B) of Type Ia SNe from the top panel after subtracting the Phillips relation. The three dashed covariance ellipses represent the 2σ ranges, which are obtained with the best-fit hierarchical Gaussian class-conditional model for the early-blue, early-red, and early-yellow populations shown with blue, red, and gold colors, respectively. The transparent, indigo, dotted–dashed covariance ellipse represents the combined distribution for early-red and early-blue events.
Other Images in This Article
Show More
Copyright and Terms & Conditions
© 2025. The Author(s). Published by the American Astronomical Society.