Image Details
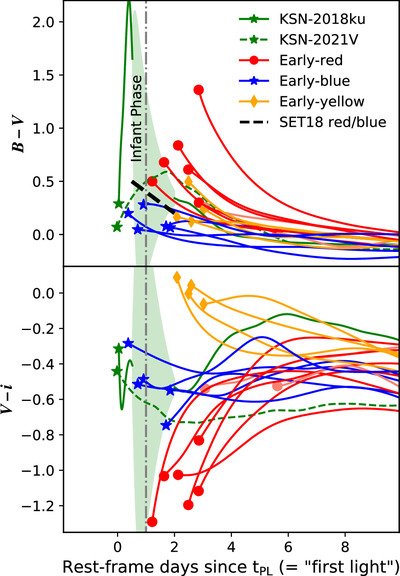
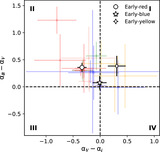
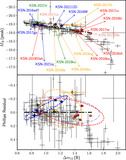
Caption: Figure 6.
Projection of the color evolution in Figure 5 onto B − V (top) and V − i (bottom) axes. The black dashed line in the top panel separates red and blue objects of SET18 based on B − V color, which approximately correspond to early-red and early-blue in this work. The green shaded region represents the gap in the observations of KSN-2018ku from ∼0.5–2.0 days, showing the 1σ uncertainties of its interpolated colors, which are particularly large due to its rapid color evolution in infancy prior to the gap within ≲0.5 day.
Other Images in This Article
Show More
Copyright and Terms & Conditions
© 2025. The Author(s). Published by the American Astronomical Society.
Copyright ©
2026 Astronomy Image Explorer. All Rights Reserved.