Image Details
Caption: Figure 1.
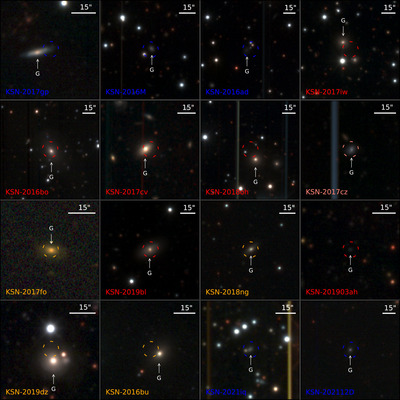
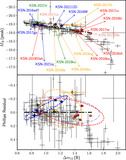
Deep BVI pre-explosion stack image stamps in RGB format for each Type Ia SN from the KSP, whose positions are indicated with dashed circles (colored by population; Section 3.3.1), showing their host galaxies (indicated with white arrows labeled “G”; Table 4). To effectively reveal faint morphological features of the galaxies, the intensity scale of the images is proportional to the square of the observed flux with minima and maxima spanning from the 1σ noise floor below the median flux to 110% of the central flux of each image at SN peak. The RGB colors are relative to that of the Sun (= 5778 K blackbody) in the host galaxy rest frame. Up is north, and east is to the left, and the width of every image stamp is equal to a physical scale of 150 kpc in the rest frame. (This figure is available as an animation showing the evolution of each Type Ia SN—from −10 days since first light to +40 days at 0.1 day intervals—in stamps of the same images but with equal angular size of 1﹩\mathop{.}\limits^{^{\prime} }﹩33 × 1﹩\mathop{.}\limits^{^{\prime} }﹩33. In the animation, synthetic point sources matching the image PSFs and smoothed BVi-band light curves are injected at the SN positions. The real-time duration of the animation is 50 seconds—i.e., 1 s = 1 day.)
(An animation of this figure is available in the online article.)
(An animation of this figure is available.)
The video/animation of this figure is available in the online journal.
Other Images in This Article
Show More
Copyright and Terms & Conditions
© 2025. The Author(s). Published by the American Astronomical Society.