Image Details
Caption: Figure 2.
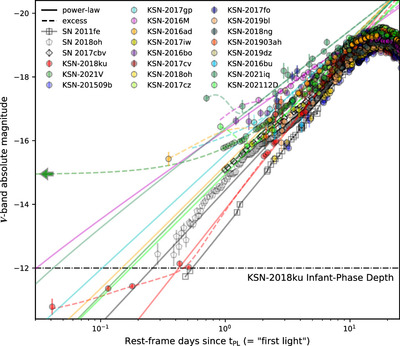
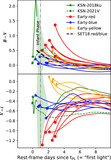
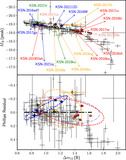
Rest-frame V-band early light curves of KSP infant/early Type Ia SNe (colored data points) compared to other prototypical normal Type Ia SNe in their nearest-to-V bands, SNe 2011fe (g/V P. E. Nugent et al. 2011), 2018oh (K2 G. Dimitriadis et al. 2019), and 2017cbv (V G. Hosseinzadeh et al. 2017), as well as the following models (Appendix D): (1) pure power-law fits (solid lines) used to estimate tPL (often called the epoch of “first light”); and (2) power-law + Gaussian fits representing early excess emission (dashed curves). The error bars represent the 1σ uncertainty level throughout the paper, unless otherwise indicated. The horizontal dotted–dashed line delineates the “infant-phase depth” >−12 mag, where the evolution of Type Ia SNe was revealed by KSN-2018ku (= SN 2018aoz; Y. Q. Ni et al. 2022, 2023b) but has remained otherwise unexplored to date. The arrow represents a detection from prior to tPL, first identified in KSN-2021V (=SN 2021aefx; Y. Q. Ni et al. 2023a).
Other Images in This Article
Show More
Copyright and Terms & Conditions
© 2025. The Author(s). Published by the American Astronomical Society.