Image Details
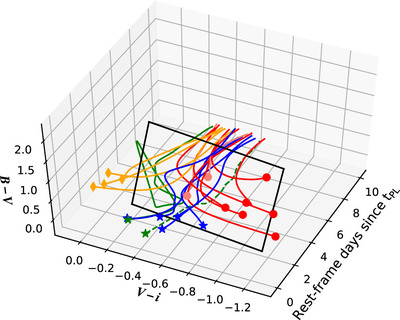
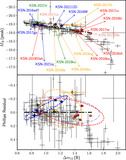
Caption: Figure 5.
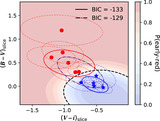
B − V (z-axis) and V − i (y-axis) multicolor evolution of the KSP Type Ia SNe along the time since tPL (= “first light”; x-axis) represented by smoothed interpolants (colored curves with symbols representing the first color detection), showing at least three populations with distinct behaviors—early-red events (red/pink with circles), early-blue events (blue with stars), and early-yellow events (gold with diamonds)—as well as SNe 2018aoz (solid green with star) and 2021aefx (dashed green with star). The events with star symbols accommodate excess emission in their early light curves, while those with circles and diamonds are consistent with pure power-law rise. The black rectangle represents the oblique slice Equation (4) that separates the early-red and early-blue populations (Section 3.3.2 and Figure 7). (This figure is available as an interactive figure where the axes can be rotated, and plot elements as well as K-corrections can be switched on/off).
An interactive version of this figure is available in the online article.
An interactive version of this figure is available.
An interactive version of this figure is available in the online journal.
Other Images in This Article
Show More
Copyright and Terms & Conditions
© 2025. The Author(s). Published by the American Astronomical Society.