

Image Details
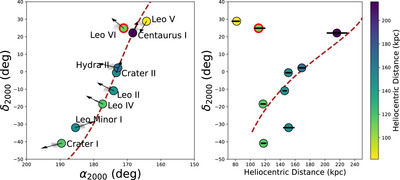
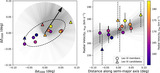
Caption: Figure 8.
Left: spatial distribution of Leo VI and other potential members of the Crater-Leo infall group. The markers are colored based on the heliocentric distance of the system. The black arrows represent the direction of the median systemic proper motion of the system (after correcting for solar reflex motion), while the faint gray lines represent the 1000 Monte Carlo samplings from the proper motion uncertainties. The proper motion for the members of the Crater-Leo infall group were obtained from M. P. Júlio et al. (2024), where we have use their Hubble Space Telescope measurements for Leo IV and Leo V. The brown line represents a great circle with a pole centered at (83﹩\mathop{.}\limits^{^\circ }﹩2, −11﹩\mathop{.}\limits^{^\circ }﹩8) that passes close to the members of the infall group (G. Torrealba et al. 2016). Right: the heliocentric distance of Leo VI and the nearby satellites as a function of decl., δJ2000. The brown line shows the orbit of the proposed Crater-Leo group from G. Torrealba et al. (2016). The plots indicate that the heliocentric distances of Leo VI and Leo Minor I are inconsistent with the distance gradient followed by the members of the Crater-Leo group.
Other Images in This Article
Show More
Copyright and Terms & Conditions
© 2025. The Author(s). Published by the American Astronomical Society.

