

Image Details
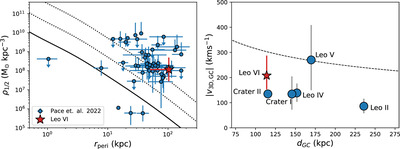
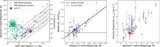
Caption: Figure 6.
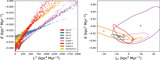
Left: the average density within the half-light radius, ρ1/2, vs. distance of the pericenter, rperi, of Leo VI and other MW satellites (A. B. Pace et al. 2022). The solid black line represents twice the enclosed MW density as a function of radius, while the dashed lines represent 20 and 200 times the enclosed MW density. If a satellite is located below the solid line, its half-light radius is estimated to be bigger than its Jacobi (tidal) radius and it is likely to be tidally disrupting (A. B. Pace et al. 2022). Right: the magnitude of the 3D Galactocentric velocity, ∣V3D,GC∣, vs. the Galactocentric distance, dGC, of Leo VI and other nearby satellite galaxies. The dashed lines represented the escape velocity of the potentials from gala’s MilkyWayPotential potential. Leo VI is likely a bound system, and thus it is likely to have reached its orbital pericenter at least once in the past.
Other Images in This Article
Show More
Copyright and Terms & Conditions
© 2025. The Author(s). Published by the American Astronomical Society.

