

Image Details
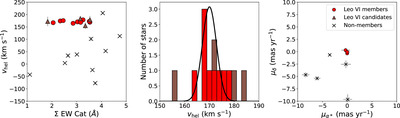
Caption: Figure 3.
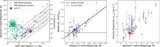
Left: the equivalent widths (EWs) of the CaT lines vs. the measured line-of-sight (radial) velocity of the target stars. The plot shows a prominent excess of stars around 155 km s−1 ≤ vhel ≤ 185 km s−1, which we assumed to be member stars (red circles) and candidate member stars (brown triangles) of Leo VI. The gray bars show the uncertainties of the line-of-sight (radial) velocity measurement. Middle: histogram of the measured heliocentric radial velocity of the Leo VI member stars and candidate member stars overlaid with the best-fit velocity dispersion model (see Section 5.2). We note that the histograms does not capture the large uncertainties in the velocity measurements for the low-S/N stars. Right: proper motions of spectroscopic targets that are bright enough (g ≲ 21) to be measured in Gaia DR3. Three of the spectroscopically confirmed member stars that also contain Gaia proper motion measurements (red circles) are found to be clustered near ﹩{\mu }_{\delta },{\mu }_{\alpha }\cos (\delta )\sim (0,0)﹩ mas yr−1.
Other Images in This Article
Show More
Copyright and Terms & Conditions
© 2025. The Author(s). Published by the American Astronomical Society.

