Image Details
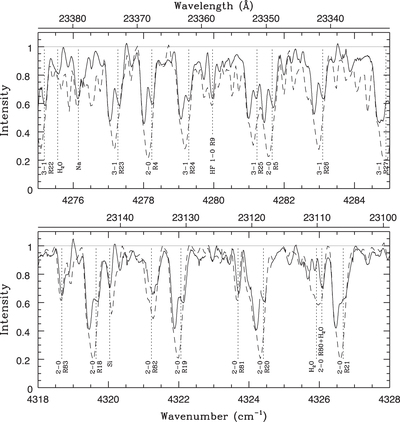
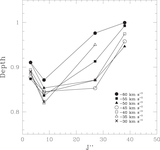
Caption: Figure 9.
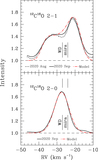
Two sections from K-band spectra of R Aqr. The dashed line is an out-of-eclipse 1989 spectrum. The solid line is the in-eclipse 2020 September spectrum. The spectra are shifted so the atomic lines appear at the rest frequency. The telluric spectrum has been removed by ratioing to synthetic reference spectra. 12C16O 2–0 and 3–1 lines are labeled. Large changes in the low-J lines (Figure 4) are apparent. For the other lines, for instance Na 4276 cm−1 (top panel) and CO R83 and R81 (bottom panel), the in-eclipse lines are slightly less deep than the out-of-eclipse lines. To compare the scale of the abscissa to the line profiles to Figure 4, broad lines, for example 2–0 R4 and 2–0 R19, have widths of ∼0.5 cm−1 corresponding to 35 km s−1.
Other Images in This Article
Show More
Copyright and Terms & Conditions
© 2022. The Author(s). Published by the American Astronomical Society.