Image Details
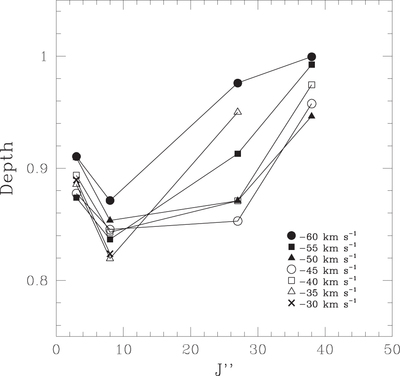
Caption: Figure 8.
Depth of absorption as a function of J″ for the 12C16O 1–0 lines in the 2020 August in-eclipse spectrum measured at 5 km s−1 velocity steps across the line profile (see symbol key on figure). The lines used are R3, R8, the average of P22, 27, and 33 plotted at J″ = 27, and P38. The line profiles are shown in Figure 5, panels (a) and (b). The measurements at the same velocity for different J″ are connected by solid lines.
Other Images in This Article
Show More
Copyright and Terms & Conditions
© 2022. The Author(s). Published by the American Astronomical Society.
Copyright ©
2026 Astronomy Image Explorer. All Rights Reserved.