Image Details
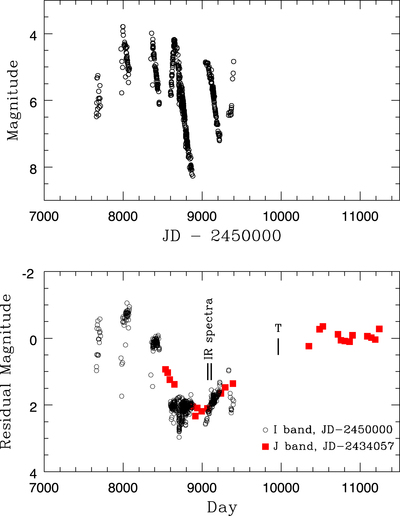
Caption: Figure 2.
Upper panel: AAVSO I-band photometry of R Aqr (black open symbols). Segments from several light cycles are present. Lower panel: data in upper panel ratioed to a mean light curve. The J-band eclipse light curve of Jurkic & Kotnik-Karuza (2018, red filled symbols) is shown shifted by one orbital period, corrected for the mean J–I color, and overplotted on the I photometry. The dates of the IR spectra and the predicted date of periastron passage (T) are shown.
Other Images in This Article
Show More
Copyright and Terms & Conditions
© 2022. The Author(s). Published by the American Astronomical Society.
Copyright ©
2026 Astronomy Image Explorer. All Rights Reserved.