Image Details
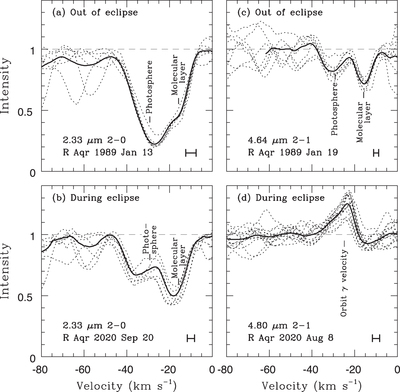
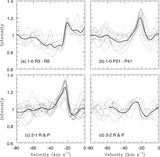
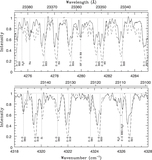
Caption: Figure 4.
Comparison of R Aqr line profiles in and out of eclipse. Individual line profiles are shown with a dotted line and the average with a solid line. The spectra have been ratioed to a telluric standard. (a) K-band CO 2–0 lines from a 1989 out-of-eclipse spectrum and (b) from the 2020 September in-eclipse spectrum. Note the difference in the depth and shape of the line profile out of eclipse and during eclipse. Individual profiles are 12C16O 2–0 R1, R3, R4, R7, and R10. (c) M-band CO 2–1 lines from a 1989 out-of-eclipse spectrum and (d) from the 2020 August in-eclipse spectrum. The 2–1 absorption lines outside of eclipse are in emission during eclipse. Individual profiles are 12C16O 2–1 R6, R7, R8, R9, R11, R13, and R14. The 2–1 R6 and R7 lines are in the segment of the spectrum shown in Figure 3. To compare scales, 0.1 cm−1 (2.5 Å) is ∼15 km ﹩{{\rm{s}}}^{{}_{1}}﹩ in the 2000 cm−1 (50000 Å) region. The 1989 spectra have been corrected by the difference in orbital velocity to the velocity of the 2020 August spectrum. The “photospheric” and “molecular layer” labels mark velocities measured from the 1989 January 13 spectrum and corrected by the orbital velocity to 2020 August. A bar of length equal to the spectral resolution is in the lower right of each panel.
Other Images in This Article
Show More
Copyright and Terms & Conditions
© 2022. The Author(s). Published by the American Astronomical Society.