Image Details
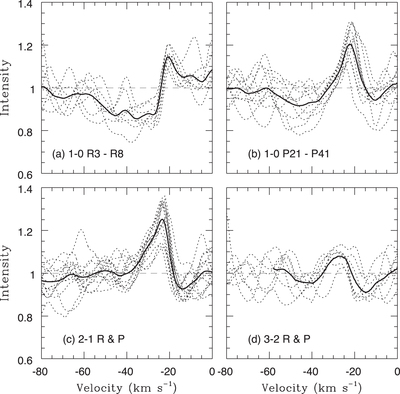
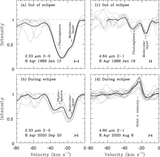
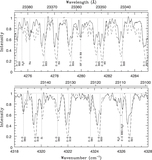
Caption: Figure 5.
Four different groups of CO lines observed in the 2020 August iSHELL in-eclipse spectrum. Note that the origin of the intensity axis is 0.6. Individual line profiles are shown with a dotted line and the average with a solid line. (a) 12C16O 1–0 R3 through R8. Emission is near −21 km s−1 with absorption extending from ∼ −25 to −60 km s−1. (b) 1–0 P J″ = 21, 22, 26, 27, 30, 32, 34, 35, 38, and 41. Broad blueshifted absorption is present but less deep than for the 1–0 R3 through R8 lines. The emission is stronger than for the lower J″ lines. (c) 2–1 P J″ = 18, 19, 22, 25, 28, 32, and 33 and R J″ = 7, 8, 9, 11, 13, 14, and 20. There is no absorption in the 2–1 profile in the −60 to −20 km s−1 region. The absorption at ∼−15 km s−1 is from the stellar photosphere and molecular layers (see Figure 4 and text). (d) 3–2 P14, P15, P19, R14, R16, R21, and R23. Emission is weak.
Other Images in This Article
Show More
Copyright and Terms & Conditions
© 2022. The Author(s). Published by the American Astronomical Society.