Image Details
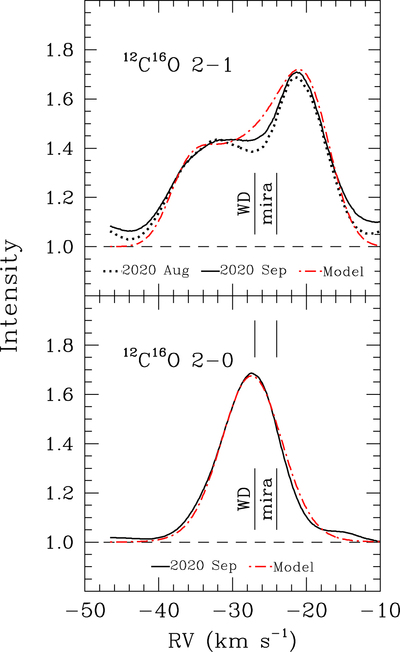
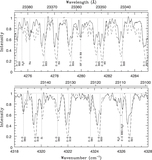
Caption: Figure 7.
Upper panel: ratio (dotted line) of the in-eclipse average 2–1 line profile observed on 2020 August (panel (d) of Figure 4) to the out-of-eclipse profile observed on 1989 January (panel (c) of Figure 4). The solid line is the ratio for 2020 September. The velocities of the WD and Mira (vertical lines) are from the predicted orbit (Figure 1). Lower panel: ratio of the average 2–0 R branch line profile observed in eclipse on 2020 September (panel (b) of Figure 4) to the out-of-eclipse 1989 profile (panel (a) of Figure 4). Intensity units are relative to the local continuum. Model fits (see text) are the red dotted–dashed line.
Other Images in This Article
Show More
Copyright and Terms & Conditions
© 2022. The Author(s). Published by the American Astronomical Society.