Image Details
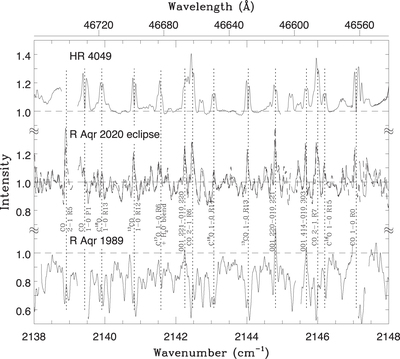
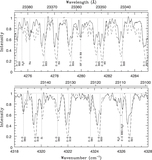
Caption: Figure 3.
A segment of the observed R Aqr M-band spectra in and out of eclipse. The spectrum of HR 4049, which is dominated by a circumbinary disk, is shown as a comparison. A selection of the emission lines are identified. The spectra have been ratioed to a telluric reference to remove the telluric spectrum. The wavenumber/wavelength scale is at laboratory rest with the spectra shifted to align the emission lines. Absorption line spectra of Miras contain multiple velocity components (Figure 4). The Mira absorption lines are at a slightly different velocity than the emission lines due to the multiple velocity components, Mira pulsation, and orbital motion. The gaps in the spectrum result from optically thick telluric lines that cannot be removed by ratioing. The two R Aqr spectra, observed in 2020 August, shown with a solid line, and September, shown with a dashed line, have been overplotted and are nearly identical.
Other Images in This Article
Show More
Copyright and Terms & Conditions
© 2022. The Author(s). Published by the American Astronomical Society.