Image Details

Caption: Figure 7.
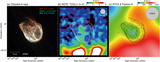
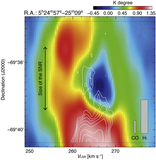
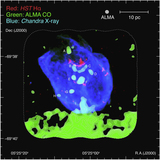
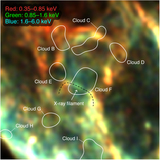
(a) RGB image of N132D obtained with the HST [O III] (red), ALMA 12CO(J = 1–0) (green contours), and Chandra O VIII emission produced using a novel method for source separation (blue, see the Appendix and Figure 11). The integration velocity range and contour levels of CO are the same as in Figure 5. Regions enclosed by solid yellow lines are used for the X-ray spectral analysis (see Section 4.6). The dashed white box represents the area shown in Figure 7(b). (b) Radial velocity distributions of O-rich knots presented by Law et al. (2020). Superposed contours indicate the ALMA 12CO(J = 1–0), whose contour levels are the same as in Figure 5. The star and filled circle represent the center of the O-rich knots and that of the X-ray shell. Major knots—B1, B2, B3, B4, R1, R2, and RK (runaway knot)—from Morse et al. (1995) are also indicated.
Other Images in This Article
Copyright and Terms & Conditions
© 2020. The American Astronomical Society. All rights reserved.