Image Details
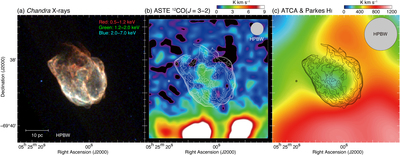
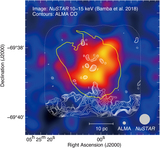
Caption: Figure 2.
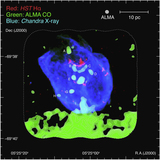
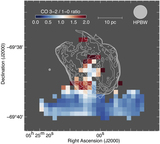
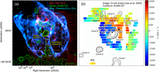
(a) RGB X-ray image of N132D obtained with Chandra (e.g., Borkowski et al. 2007; Xiao & Chen 2008; Sharda et al. 2020). The red, green, and blue colors represent the energy bands 0.5–1.2 keV, 1.2–2.0 keV, and 2.0–7.0 keV, respectively. (b) Intensity map of 12CO(J = 3–2) obtained with ASTE overlaid with the Chandra X-ray contours. The integration velocity range is from 256.8 km s−1 to 271.2 km s−1. The black contours represent the X-ray intensities: 0.3, 0.6, 1.8, 3.6, 7.2, and ﹩14.4\times {10}^{-6}﹩ counts pixel−1 s−1. (c) Intensity map of H I obtained with ATCA and Parkes (Kim et al. 2003) overlaid with the Chandra X-ray contours. The integration velocity range and contour levels are the same as in Figure 2(b). The beam size and scale bar are also shown.
Other Images in This Article
Copyright and Terms & Conditions
© 2020. The American Astronomical Society. All rights reserved.