Image Details
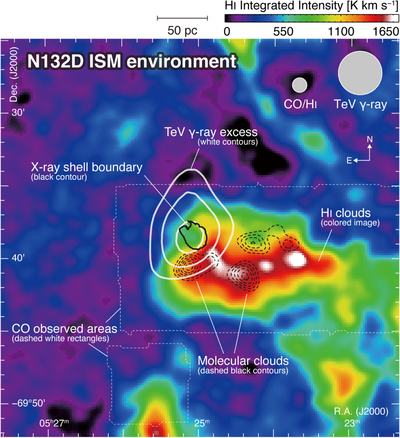
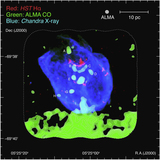
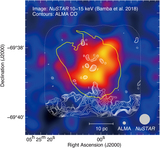
Caption: Figure 1.
Integrated intensity map of the ATCA and Parkes H I (Kim et al. 2003, colored image) overlaid with the Mopra 12CO(J = 1–0) integrated intensity (black dashed contours), Chandra X-ray boundary of N132D (Borkowski et al. 2007, black solid contour), and the H.E.S.S. teraelectronvolt gamma-ray excess counts (H.E.S.S. Collaboration et al. 2015, white solid contours). The CO data have been spatially smoothed to match the FWHM of H I (∼﹩60^{\prime\prime} ﹩). The integration velocity ranges of CO and H I are from 240 to 290 km s−1, which cover 74% of the total integrated intensity of H I. The lowest contour level and intervals of CO are 6.3 K km s−1 (∼9σ) and 2.1 K km s−1 (∼3σ), respectively. The contour level of the X-ray boundary is ﹩0.3\times {10}^{-6}﹩ counts pixel−1 s−1. The contour levels of teraelectronvolt gamma rays are 10, 14, and 18 excess counts. The dashed white rectangles indicate the observed areas of CO. The FWHM beam size of CO/H I and the PSF of the teraelectronvolt gamma rays are also shown in the top right corner.
Other Images in This Article
Copyright and Terms & Conditions
© 2020. The American Astronomical Society. All rights reserved.