Image Details
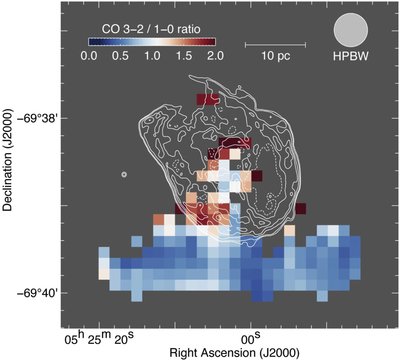
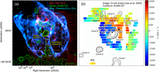
Caption: Figure 6.
Intensity ratio map of 12CO(J = 3–2)/12CO(J = 1–0) using ASTE and ALMA. The ALMA data were smoothed to match the effective beam size of the ASTE data (an effective beam size of ﹩23^{\prime\prime} ﹩). The beam size and scale bar are also shown in the top right corner. The velocity range is the same as in Figure 5. White dashed contours represent the X-ray intensity, whose contour levels are the same as in Figure 2(b). The gray areas represent that the 12CO(J = 1–0) or 12(J = 3–2) data show a low significance of ∼8σ or lower.
Other Images in This Article
Copyright and Terms & Conditions
© 2020. The American Astronomical Society. All rights reserved.
Copyright ©
2026 Astronomy Image Explorer. All Rights Reserved.