Image Details
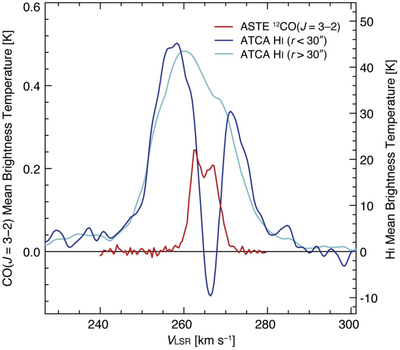
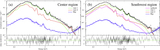
Caption: Figure 4.
Averaged line profiles of 12CO(J = 3–2) (red) and H I (blue and cyan) toward the SNR N132D. The blue and cyan spectra were extracted from regions inside and outside a circle with radius ﹩30^{\prime\prime} ﹩ at the center position of (﹩{\alpha }_{{\rm{J}}2000}﹩, ﹩{\delta }_{{\rm{J}}2000}﹩) ∼ (﹩{05}^{{\rm{h}}}{25}^{{\rm{m}}}02\buildrel{\rm{s}}\over{.} 88﹩, ﹩-69^\circ 38^{\prime} 34\buildrel{\prime\prime}\over{.} 8﹩). The red spectrum was produced by averaging the whole spectra shown in Figure 2(b).
Other Images in This Article
Copyright and Terms & Conditions
© 2020. The American Astronomical Society. All rights reserved.
Copyright ©
2026 Astronomy Image Explorer. All Rights Reserved.