Image Details
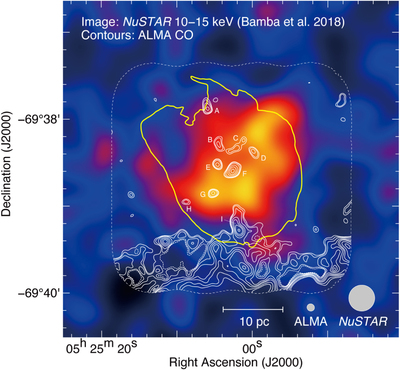
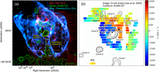
Caption: Figure 9.
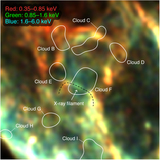
Map of hard X-ray emission (E: 10–15 keV) obtained with NuSTAR (Bamba et al. 2018). The white and yellow contours indicate the ALMA 12CO(J = 1–0) and the boundary of the X-ray shell. The contour levels and integration velocity range of CO are the same as in Figure 5. The beam size and scale bar are also shown in the bottom right corner of the panel. The CO clouds A to I are also indicated.
Other Images in This Article
Copyright and Terms & Conditions
© 2020. The American Astronomical Society. All rights reserved.
Copyright ©
2026 Astronomy Image Explorer. All Rights Reserved.