Image Details
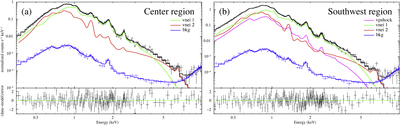
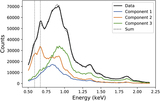
Caption: Figure 8.
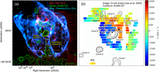
(a) ACIS-S spectra of the center (cloud F) and southwest (reference), with the best-fit models shown in the top panels. The magenta, green, red, and blue lines represent vpshock, vnei 1, vnei 2, and background components, respectively. The black lines represent the sum of the components. The bottom panels in each figure indicate (data − model)/error.
Other Images in This Article
Copyright and Terms & Conditions
© 2020. The American Astronomical Society. All rights reserved.
Copyright ©
2026 Astronomy Image Explorer. All Rights Reserved.