Image Details
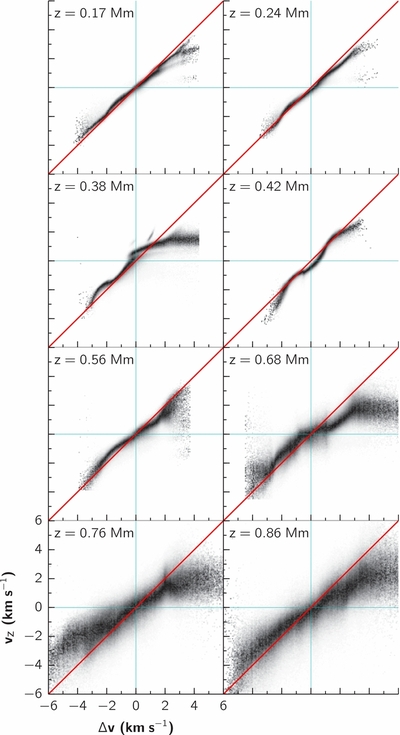
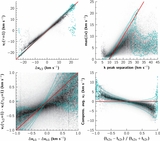
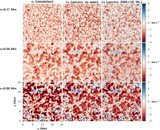
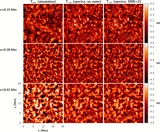
Caption: Figure 9.
PDFs for the atmospheric vertical velocity being v z when the observed velocity shifts derived from photospheric lines are Δ v, at different depths and combining all snapshots. Darker means more frequent. The diagonal red lines depict y = x; the cyan lines depict the zero velocities.
Other Images in This Article
Show More
Copyright and Terms & Conditions
© 2013. The American Astronomical Society. All rights reserved.
Copyright ©
2025 Astronomy Image Explorer. All Rights Reserved.