Image Details
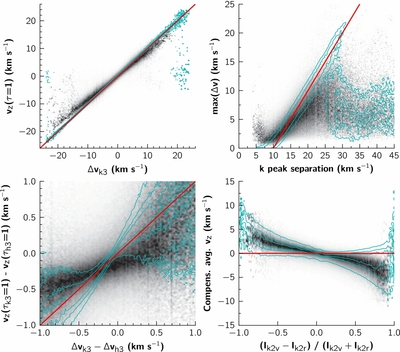
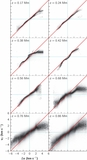
Caption: Figure 5.
Probability density functions for different atmospheric properties ( y axes) for different values of the observed quantities ( x axes), comparing the data extracted from spectra convolved with the instrumental profile of IRIS (grayscale; darker means more frequent) and for the original spectra (cyan contours). Top-left panel: k 3 velocity shift versus atmospheric velocity at the corresponding height where τ = 1; the red line denotes y = x. Bottom-left panel: difference between k 3 and h 3 velocity shifts versus the difference in corresponding τ = 1 atmospheric velocities; the red line denotes y = x. Top-right panel: k peak separation vs. the maximum atmospheric velocity extremes between the formation height of the k 2 and k 3; the red line denotes y = x −10. Bottom-right panel: intensity ratio of k 2 peaks versus the compensated average v z (see text); the red line denotes y = 0.
Other Images in This Article
Show More
Copyright and Terms & Conditions
© 2013. The American Astronomical Society. All rights reserved.