Image Details
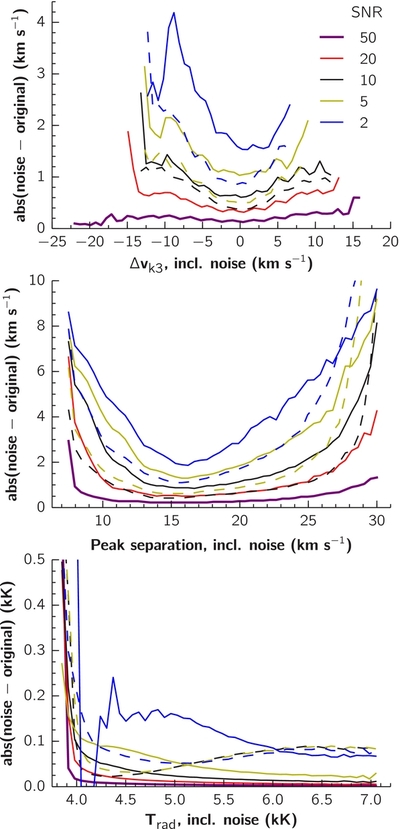
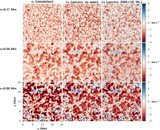
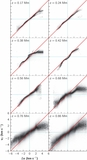
Caption: Figure 7.
Median values of the absolute difference between quantities derived from spectra with and without noise, for bins in the quantities in the x axes. We show results for different S/Ns, as per the legend. The dashed lines of the same color (only shown for S/Ns of 2, 5, and 10) show the results for the noisy spectra when a Wiener filter was applied (see the text). Top panel: effect of noise on the k 3 velocity shifts, middle panel: effect of noise on the k 2 peak separation, and bottom panel: effect of noise on the k 2 V radiation temperature.
Other Images in This Article
Show More
Copyright and Terms & Conditions
© 2013. The American Astronomical Society. All rights reserved.
Copyright ©
2025 Astronomy Image Explorer. All Rights Reserved.