Image Details
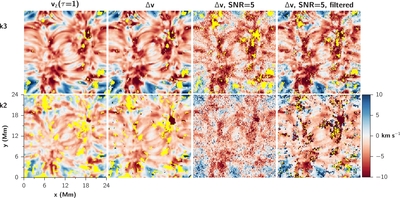
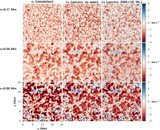
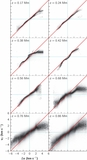
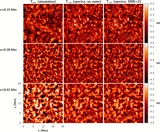
Caption: Figure 4.
Velocity maps for the k 3 line core (top panels) and k 2 peaks (bottom panels). The color scale is clipped at −10 km s −1 and 10 km s −1 to maximize contrast. The yellow points represent locations where the detection algorithm failed to find the features. The first column shows the atmospheric velocity at the feature's τ = 1 depth. The remaining columns show the velocity shift of the feature as detected from the spectra, for spectra without noise, with noise at S/N of 5, and with noise at S/N of 5 but using a Wiener filter (see the text), respectively.
Other Images in This Article
Show More
Copyright and Terms & Conditions
© 2013. The American Astronomical Society. All rights reserved.
Copyright ©
2025 Astronomy Image Explorer. All Rights Reserved.