Image Details
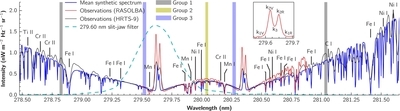
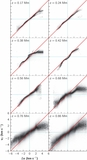
Caption: Figure 1.
Spatially and temporally averaged synthetic spectrum, compared with observations from RASOLBA (Staath & Lemaire 1995) and HRTS-9 (Morrill & Korendyke 2008). The transmission function for the IRIS 279.60 nm slit-jaw filter is also shown (in arbitrary units). Also noted are the locations of the photospheric lines used in Section 4.3 and the quasi-continuum groups used in Section 4.4. The inset shows the location of the k 1, k 2, and k 3 spectral features.
Other Images in This Article
Show More
Copyright and Terms & Conditions
© 2013. The American Astronomical Society. All rights reserved.
Copyright ©
2025 Astronomy Image Explorer. All Rights Reserved.