Image Details
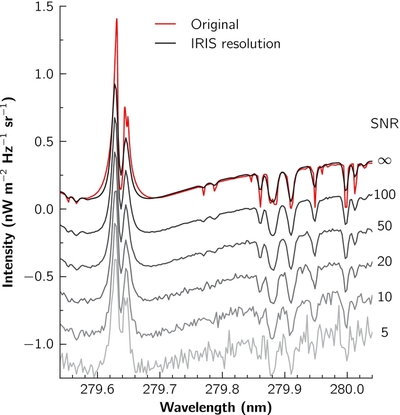
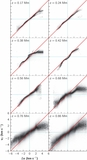
Caption: Figure 2.
Effects of IRIS spatial and spectral resolution and noise on the NUV spectrum near the Mg ii k line. The original spectrum was taken from a single simulation pixel. This pixel was brighter than its surroundings and was chosen so that the Mg ii k intensity was similar to the mean observed value. The S/N is measured at the last wavelength shown (280.042 nm). For clarity, spectra of different S/Ns are offset 0.25 nW m −2 Hz −1 sr −1 from each other.
Other Images in This Article
Show More
Copyright and Terms & Conditions
© 2013. The American Astronomical Society. All rights reserved.
Copyright ©
2025 Astronomy Image Explorer. All Rights Reserved.