Image Details
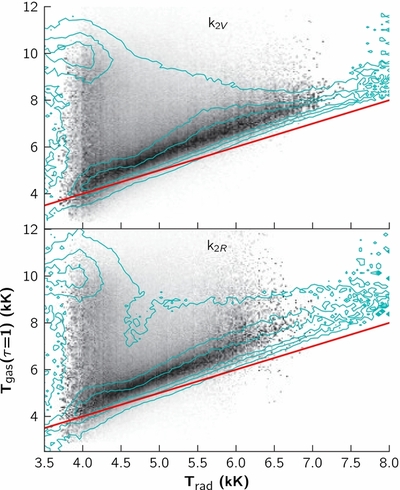
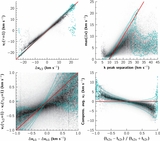
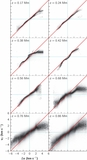
Caption: Figure 6.
PDFs for the gas temperature at an optical depth of unity being T gas when the observed k 2 V (top) and k 2 R (bottom) radiation temperatures are T rad, extracted from spectra convolved with the instrumental profile of IRIS (grayscale; darker means more frequent) and for the original spectra (cyan contours). The red line denotes y = x.
Other Images in This Article
Show More
Copyright and Terms & Conditions
© 2013. The American Astronomical Society. All rights reserved.
Copyright ©
2025 Astronomy Image Explorer. All Rights Reserved.