Image Details
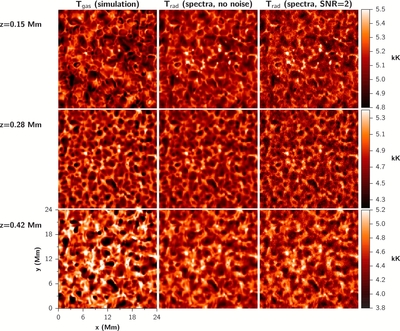
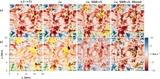
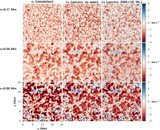
Caption: Figure 10.
Temperature maps for three photospheric heights, showing the atmospheric gas temperature T gas at a given geometrical height and the radiation temperature T gas derived from the spectra. The color scale is clipped to maximize contrast. The middle panels shows the T gas when no noise was applied to the spectra and the right panels show when Poisson noise was added with a S/N of 2.
Other Images in This Article
Show More
Copyright and Terms & Conditions
© 2013. The American Astronomical Society. All rights reserved.
Copyright ©
2025 Astronomy Image Explorer. All Rights Reserved.