

Image Details
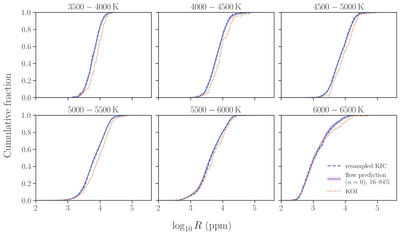
Caption: Figure 8.
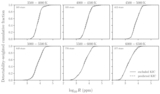
Cumulative distributions of r in the same 500 K bins as Figure 5, comparing the KIC sample pooled over 200 resampling realizations (blue dashed lines), the flow predictions under α = 0 (purple solid lines), and the KOI sample (orange dotted lines). The flow predictions average the conditional cumulative distributions evaluated at each KOI’s observed y, with equal weights. The purple bands show the 16th–84th percentile range at each value of r among 5000 simulated KOI samples, generated by independently drawing one amplitude per KOI while holding its y fixed. These bands describe the variation expected for the observed number of KOIs at fixed flow density and do not include uncertainty in its estimation.
Other Images in This Article
Copyright and Terms & Conditions
© 2026. The Author(s). Published by the American Astronomical Society.

