

Image Details
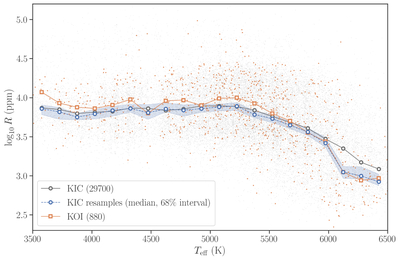
Caption: Figure 3.
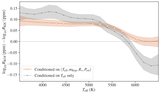
Median photometric modulation amplitude as a function of effective temperature for the original KIC sample (gray circles), the KIC resamples (blue circles), and the KOI sample (orange squares). Small gray and orange points show the individual KIC and KOI stars, respectively. The blue shaded region shows the 16th–84th percentile interval among the 200 resampling realizations. Medians are evaluated in 150 K bins.
Other Images in This Article
Copyright and Terms & Conditions
© 2026. The Author(s). Published by the American Astronomical Society.

Copyright ©
2026 Astronomy Image Explorer. All Rights Reserved.
