

Image Details
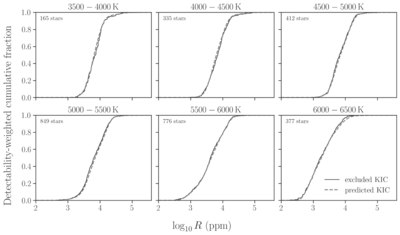
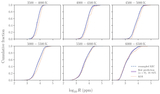
Caption: Figure 7.
Validation of the flow model using the cumulative distributions of r for the 2914 KIC stars excluded from training. Black solid lines show the empirical cumulative distributions, with each star weighted by ﹩{\pi }_{{\rm{D}}| {\rm{TR}}}﹩. Gray dashed lines show the conditional cumulative distributions predicted at each star’s observed ﹩({T}_{{\rm{eff}}},{m}_{{\rm{Kep}}},\mathrm{log}{R}_{\star },\mathrm{log}{P}_{{\rm{rot}}})﹩ and averaged over the stars in the panel using the same weights.
Other Images in This Article
Copyright and Terms & Conditions
© 2026. The Author(s). Published by the American Astronomical Society.

Copyright ©
2026 Astronomy Image Explorer. All Rights Reserved.
