

Image Details
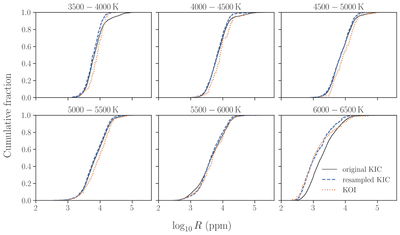
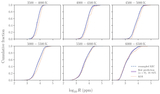
Caption: Figure 5.
Empirical cumulative distributions of r in 500 K bins for the original KIC sample (black solid lines), the KIC sample pooled over the 200 resampling realizations (blue dashed lines), and the KOI sample (orange dotted lines).
Other Images in This Article
Copyright and Terms & Conditions
© 2026. The Author(s). Published by the American Astronomical Society.

Copyright ©
2026 Astronomy Image Explorer. All Rights Reserved.
