

Image Details
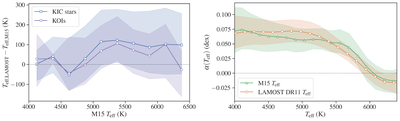
Caption: Figure 11.
Sensitivity to the adopted effective temperatures. Left: Teff,LAMOST − Teff,M15 for the final LAMOST-matched KIC and KOI samples, summarized in 250 K bins of Teff,M15. The curves show the bin medians and the shaded regions enclose the 16th–84th percentiles of the individual temperature differences. Right: the inferred amplitude shift for the same 9401 KIC stars and 287 KOIs, using either the M15 effective temperatures (green triangles) or the LAMOST DR11 effective temperatures (orange circles) consistently for both the KIC reference density and the KOI likelihood. The curves and shaded regions show the posterior medians and 16th–84th percentile intervals. All inputs and analysis settings other than the effective-temperature measurements are held fixed; only the common, well-supported interval 4000–6400 K is shown in the right panel.
Other Images in This Article
Copyright and Terms & Conditions
© 2026. The Author(s). Published by the American Astronomical Society.

