

Image Details
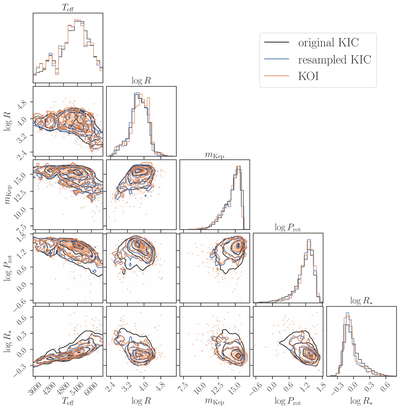
Caption: Figure 4.
Marginal and pairwise joint distributions of Teff, r, mKep, ﹩\mathrm{log}{P}_{{\rm{rot}}}﹩, and ﹩\mathrm{log}{R}_{\star }﹩ for the original KIC sample (black), the resampled KIC sample (blue), and the KOI sample (orange). The resampled distribution is represented by 50,000 stars randomly selected from the pooled 200 realizations. The resampling matches Teff, mKep, ﹩\mathrm{log}{P}_{{\rm{rot}}}﹩, and ﹩\mathrm{log}{R}_{\star }﹩ to the KOI sample; r is shown for comparison but is not used in the matching. The contours enclose approximately 12%, 39%, 68%, and 86% of each distribution, corresponding to the default 0.5σ, 1σ, 1.5σ, and 2σ levels for a two-dimensional Gaussian distribution.
Other Images in This Article
Copyright and Terms & Conditions
© 2026. The Author(s). Published by the American Astronomical Society.

