

Image Details
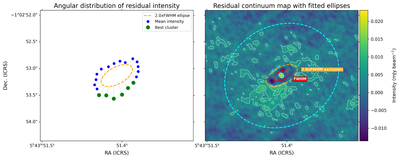
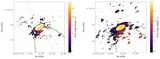
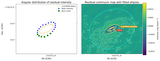
Caption: Figure D1.
Left: angular distribution of residual continuum emission in Band 9, averaged in angular bins around the fitted exclusion ellipse. The orange dashed ellipse marks the exclusion region, blue points show the mean intensity, and green points highlight the most significant cluster. Right: residual continuum map after subtraction of the best-fit two-dimensional Gaussian. The red dashed ellipse shows the FWHM, the orange ellipse shows the exclusion region (2 × FWHM), and the cyan ellipse shows the offset boundary used in the directional analysis.
Other Images in This Article
Copyright and Terms & Conditions
© 2026. The Author(s). Published by the American Astronomical Society.

Copyright ©
2026 Astronomy Image Explorer. All Rights Reserved.
