

Image Details
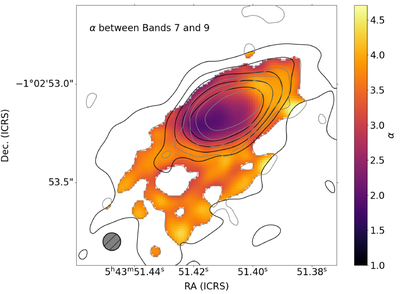
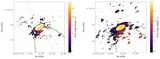
Caption: Figure 4.
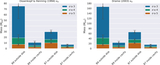
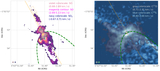
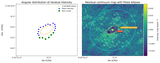
The spectral index α between ALMA Bands 7 and 9 (color). Both datasets have been smoothed to a 0﹩\mathop{.}\limits^{{\unicode{x02033}}}﹩09 beam size (shown as hatched circle in lower left). Overlaid are contours for the Band 7 (black) and Band 9 (gray) continuum emission. The contours are drawn at 4σ, 8σ, 12σ, 20σ, and 40σ. A value of 4σ in Bands 7 and 9 corresponds to 0.56 and 8.8 mJy beam−1 for a 0﹩\mathop{.}\limits^{{\unicode{x02033}}}﹩09 beam, respectively.
Other Images in This Article
Copyright and Terms & Conditions
© 2026. The Author(s). Published by the American Astronomical Society.

Copyright ©
2026 Astronomy Image Explorer. All Rights Reserved.
