

Image Details
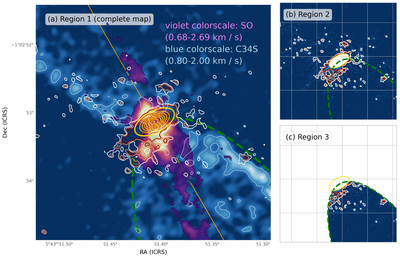
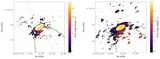
Caption: Figure 3.
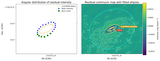
(a) SO (98–87) and C34S (7–6) integrated emission moment 0 maps using data from B. Tabone et al. (2017; violet and blue color scale, respectively); SO is masked below 2.5 times the rms noise level of the moment map, and the light blue line contour signifies the 3σ level of the C34S moment map. (See Figure C1 for more detailed view of specific molecular lines, including C17O.) Overlaid is the reimaged Band 9 continuum emission (white, salmon, and red line contours at 3σ, 4σ, and ≥5σ, respectively). The dashed green ellipse encloses the region where significant C34S and SO emission is observed to the south-southwest, which we adopt as the breadth of the outflow cavity on the redshifted side of the outflow. The yellow contours show a two-dimensional Gaussian fit to the central emission in Band 9 (and shown at intervals of 4σ, 5σ, 10σ, 15σ, etc., where σ is the rms value of the Band 9 data). The orange line denotes the bisection of C34S emission lobes, and the beam size is indicated at the bottom left of panel (a). Panel (a) represents what we refer to as Region 1, with no masking for the purpose of dust mass calculations. Panels (b) and (c) show continuum emission only in masked regions used for mass estimates outside the disk (Region 2) and inside the cavity (Region 3), respectively (see Appendix B, Table B1), for the purposes of mass calculations presented in Table 2.
Other Images in This Article
Copyright and Terms & Conditions
© 2026. The Author(s). Published by the American Astronomical Society.

