

Image Details
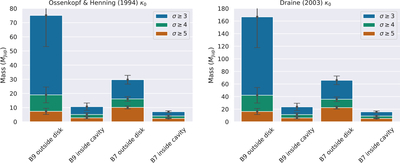
Caption: Figure 6.
Histograms of the estimated masses of indicated regions observed with Bands 7 and 9, using Equation (3) and the data in Table 2. Uncertainties in mass are calculated using the rms values (ΔM ∝ rms) and uncertainties in β values, and are shown as black error bars. Left: estimated mass adopting κλ ∝ κλ,0(λ/1 mm)−β, with κλ,0 = 0.078 cm2 g−1 (V. Ossenkopf & T. Henning 1994). Right: estimated mass adopting κλ,0 = 0.35 cm2 g−1 (B. T. Draine 2003a, 2003b). Note the difference in the scaling of the y-axis between panels.
Other Images in This Article
Copyright and Terms & Conditions
© 2026. The Author(s). Published by the American Astronomical Society.

Copyright ©
2026 Astronomy Image Explorer. All Rights Reserved.
