

Image Details
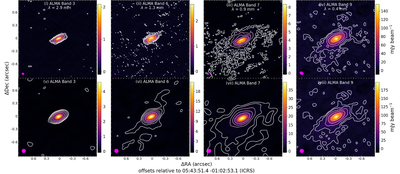
Caption: Figure 2.
Continuum emission toward HH 212 at multiple frequencies. The top row of the figure presents images across ALMA bands at their native cell and beam size. The bottom row presents the same data, but convolved to the same beam and cell size based on the Band 9 data as a template. Contours are drawn at 3σ and 5σ (white), and 10σ, 20σ, and 50σ (pink) for each image (see Table 1). The scaling in each panel is according to the peak intensity of each image, and color bars are shown (in units of mJy beam–1) for each panel. More information about image-specific parameters can be found in Table 1.
Other Images in This Article
Copyright and Terms & Conditions
© 2026. The Author(s). Published by the American Astronomical Society.

Copyright ©
2026 Astronomy Image Explorer. All Rights Reserved.
