

Image Details
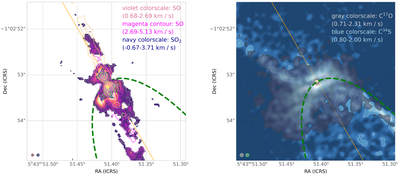
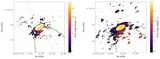
Caption: Figure C1.
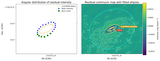
Left: SO (98–87) and SO2 (82,6–71,7) integrated emission moment 0 maps using data from B. Tabone et al. (2017; magenta and blue color scale, respectively); both SO and SO2 are masked below 2.5 times the rms noise level, and the outer contours signify the 3σ level of the respective moment maps. Magenta contours (at levels of 3σ, 5σ, 10σ, and 15σ) show the higher-velocity redshifted channels of SO (note that the full range of higher-velocity redshifted channels were not observed). Right: C17O (3–2) and C34S (B. Tabone et al. 2017) integrated emission moment 0 maps (gray and blue color scale, respectively); C17O is masked below 5 times the rms noise level of the moment 0 map, and the outer contour signifies the 5σ level. In both panels, the dashed green ellipse and orange diagonal lines are the same as in Figure 3, for reference. Small ellipses in lower left corners of each panel represent the synthesized beams of the respective datasets indicated with the same colors in the upper right corners.
Other Images in This Article
Copyright and Terms & Conditions
© 2026. The Author(s). Published by the American Astronomical Society.

