

Image Details
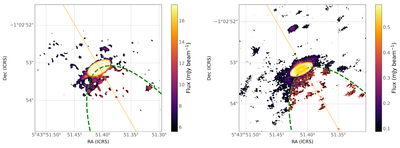
Caption: Figure 5.
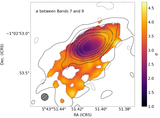
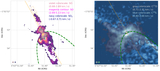
Band 9 (left) and 7 (right) continuum maps (color) at ≥3σ and masked to remove the disk component. A two-dimensional Gaussian was fit to the central emission (yellow contours, at levels of 3σ, 5σ, 10σ, and then intervals of 20σ) and subsequently subtracted from the images. Orange-red contours show 3σ, 4σ, and 5σ levels. As before, the dashed green contour encloses the region where significant C34S emission is observed to the southwest, and the orange line denotes the bisection of C34S emission lobes.
Other Images in This Article
Copyright and Terms & Conditions
© 2026. The Author(s). Published by the American Astronomical Society.

Copyright ©
2026 Astronomy Image Explorer. All Rights Reserved.
