

Image Details
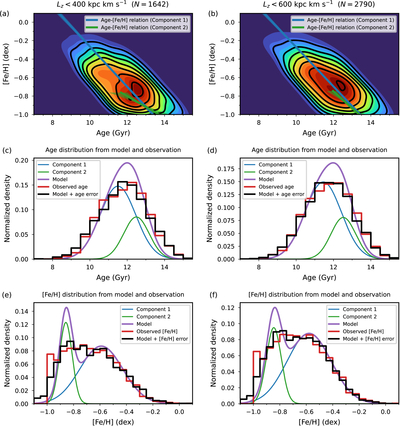
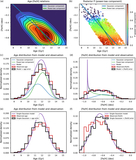
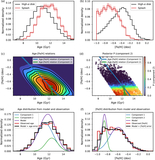
Caption: Figure C3.
Two-Gaussian decomposition of the Splash samples selected with the alternative angular-momentum cuts defined in Figure C1(c). The left column corresponds to Lz < 400 kpc km s−1, and the right column to Lz < 600 kpc km s−1. Panels (a) and (b) show the selection-corrected age–[Fe/H] distributions together with the best-fitting age–[Fe/H] relations of the two Gaussian components. Panels (c) and (d) show the observed and model age distributions, while panels (e) and (f) show the corresponding [Fe/H] distributions. All other plotting conventions are the same as in Figure 2.
Other Images in This Article
Copyright and Terms & Conditions
© 2026. The Author(s). Published by the American Astronomical Society.

Copyright ©
2026 Astronomy Image Explorer. All Rights Reserved.
