

Image Details
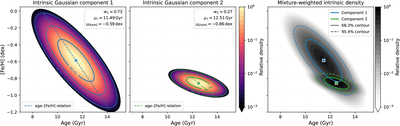
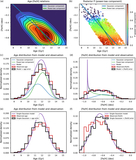
Caption: Figure 3.
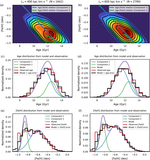
Intrinsic age–[Fe/H] density distributions of the two Gaussian components inferred for the Splash population. The left and middle panels show the two components separately, evaluated from their intrinsic covariance matrices before convolution with the individual age and metallicity uncertainties. The color shading shows the density normalized by the peak of each component on a logarithmic scale, and the contours enclose 68.3%, 95.4%, and 99.7% of the corresponding bivariate Gaussian probability. The dashed lines show the fitted conditional mean age at each metallicity, τ = a[Fe/H] + b. Because the model allows an intrinsic spread in age at fixed [Fe/H], these lines do not necessarily coincide with the major axes of the two-dimensional Gaussian contours. The crosses mark the component means, while the mixture weights and mean ages and metallicities are listed in the upper-right corners. The right panel shows the mixture-weighted intrinsic density, pmix = w1p1 + w2p2, normalized by its peak. The solid and dashed blue and green curves indicate the 68.3% and 95.4% contours of the individual components, respectively.
Other Images in This Article
Copyright and Terms & Conditions
© 2026. The Author(s). Published by the American Astronomical Society.

