

Image Details
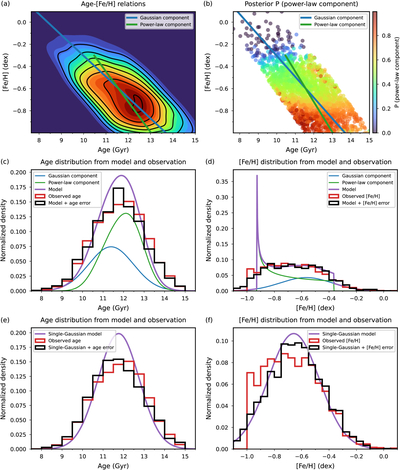
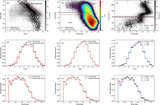
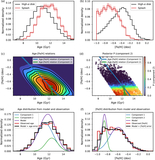
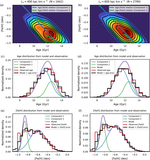
Caption: Figure B1.
Gaussian + power law and single-Gaussian modeling of the age–metallicity ([Fe/H]) distribution of the Splash population. Panel (a) shows the age–[Fe/H] distribution as a selection-weighted two-dimensional KDE, with colors indicating density and black contours marking isodensity levels. Blue and green lines show the best-fitting relations of the Gaussian and power-law components, respectively. The shaded regions indicate the point-wise 16th–84th percentile bootstrap intervals in [Fe/H] at fixed age. The bootstrap intervals are narrow over most of the fitted range and therefore largely overlap the best-fitting relations. The power-law relation and its band are clipped to the best-fitting [Fe/H] range. Panel (b) shows the posterior probability that each star belongs to the power-law component, with the same relations and uncertainty bands as in panel (a). The second row, panels (c) and (d), compares the selection-corrected age and [Fe/H] distributions with the Gaussian + power law model. Blue and green curves show the individual components, and the purple curve shows their sum. The third row, panels (e) and (f), shows the corresponding comparison for the single-Gaussian model. In both rows, red histograms show the observed distributions and black histograms show mock distributions after convolution with observational uncertainties.
Other Images in This Article
Copyright and Terms & Conditions
© 2026. The Author(s). Published by the American Astronomical Society.

